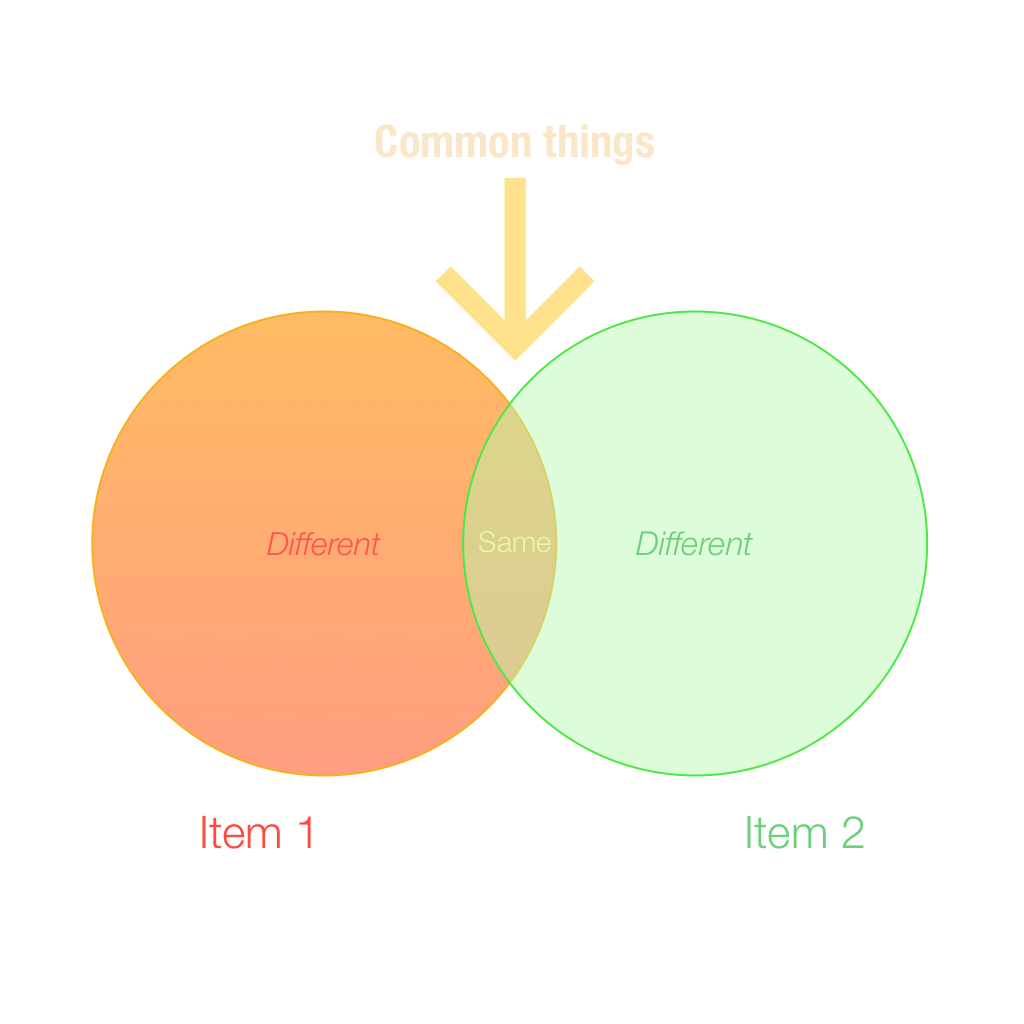
The Venn diagram, a.k.a. set diagram, is a diagram that shows which are all the possible logical relations between a collections of sets. The Venn diagram is used in many fields, primary academics, but also statistics, computer science, linguistics, logic, and probability. Every Venn diagram will usually comprise overlapping circles, with the exterior symbolizing the differences between the elements being compared, and the interior of the circle representing the common characteristics of the elements being compared. These type of diagrams are the best methods applied in showing the relationship between various sets.
History of Venn Diagrams
The Venn diagram was first designed in 1880 by John Venn. He aimed to show that propositions can be represented, in a different way using diagrams. Their format was a logical one. At that time, John Venn referred to the Venn diagram as the “Eulerian circle”, because it resembles Euler diagrams, invented by Leonhard Euler. You should know that Venn diagrams show all the possible relationships between a collection of sets, on the other hand, an Euler diagram only shows relationships that exist in real world. In 1918, American academic philosopher Clarence Irving Lewis used the term “Venn diagram” for the first time.
Advantages Of Venn Diagrams
- Visualization of concepts is easier
- Colorful presentations catch the eye faster
- Simple and versatile
- Emphasize the differences and similarities easily
- Very adaptive and less time consuming
Venn Stencils in Grafio
![]() 15 objects
15 objects
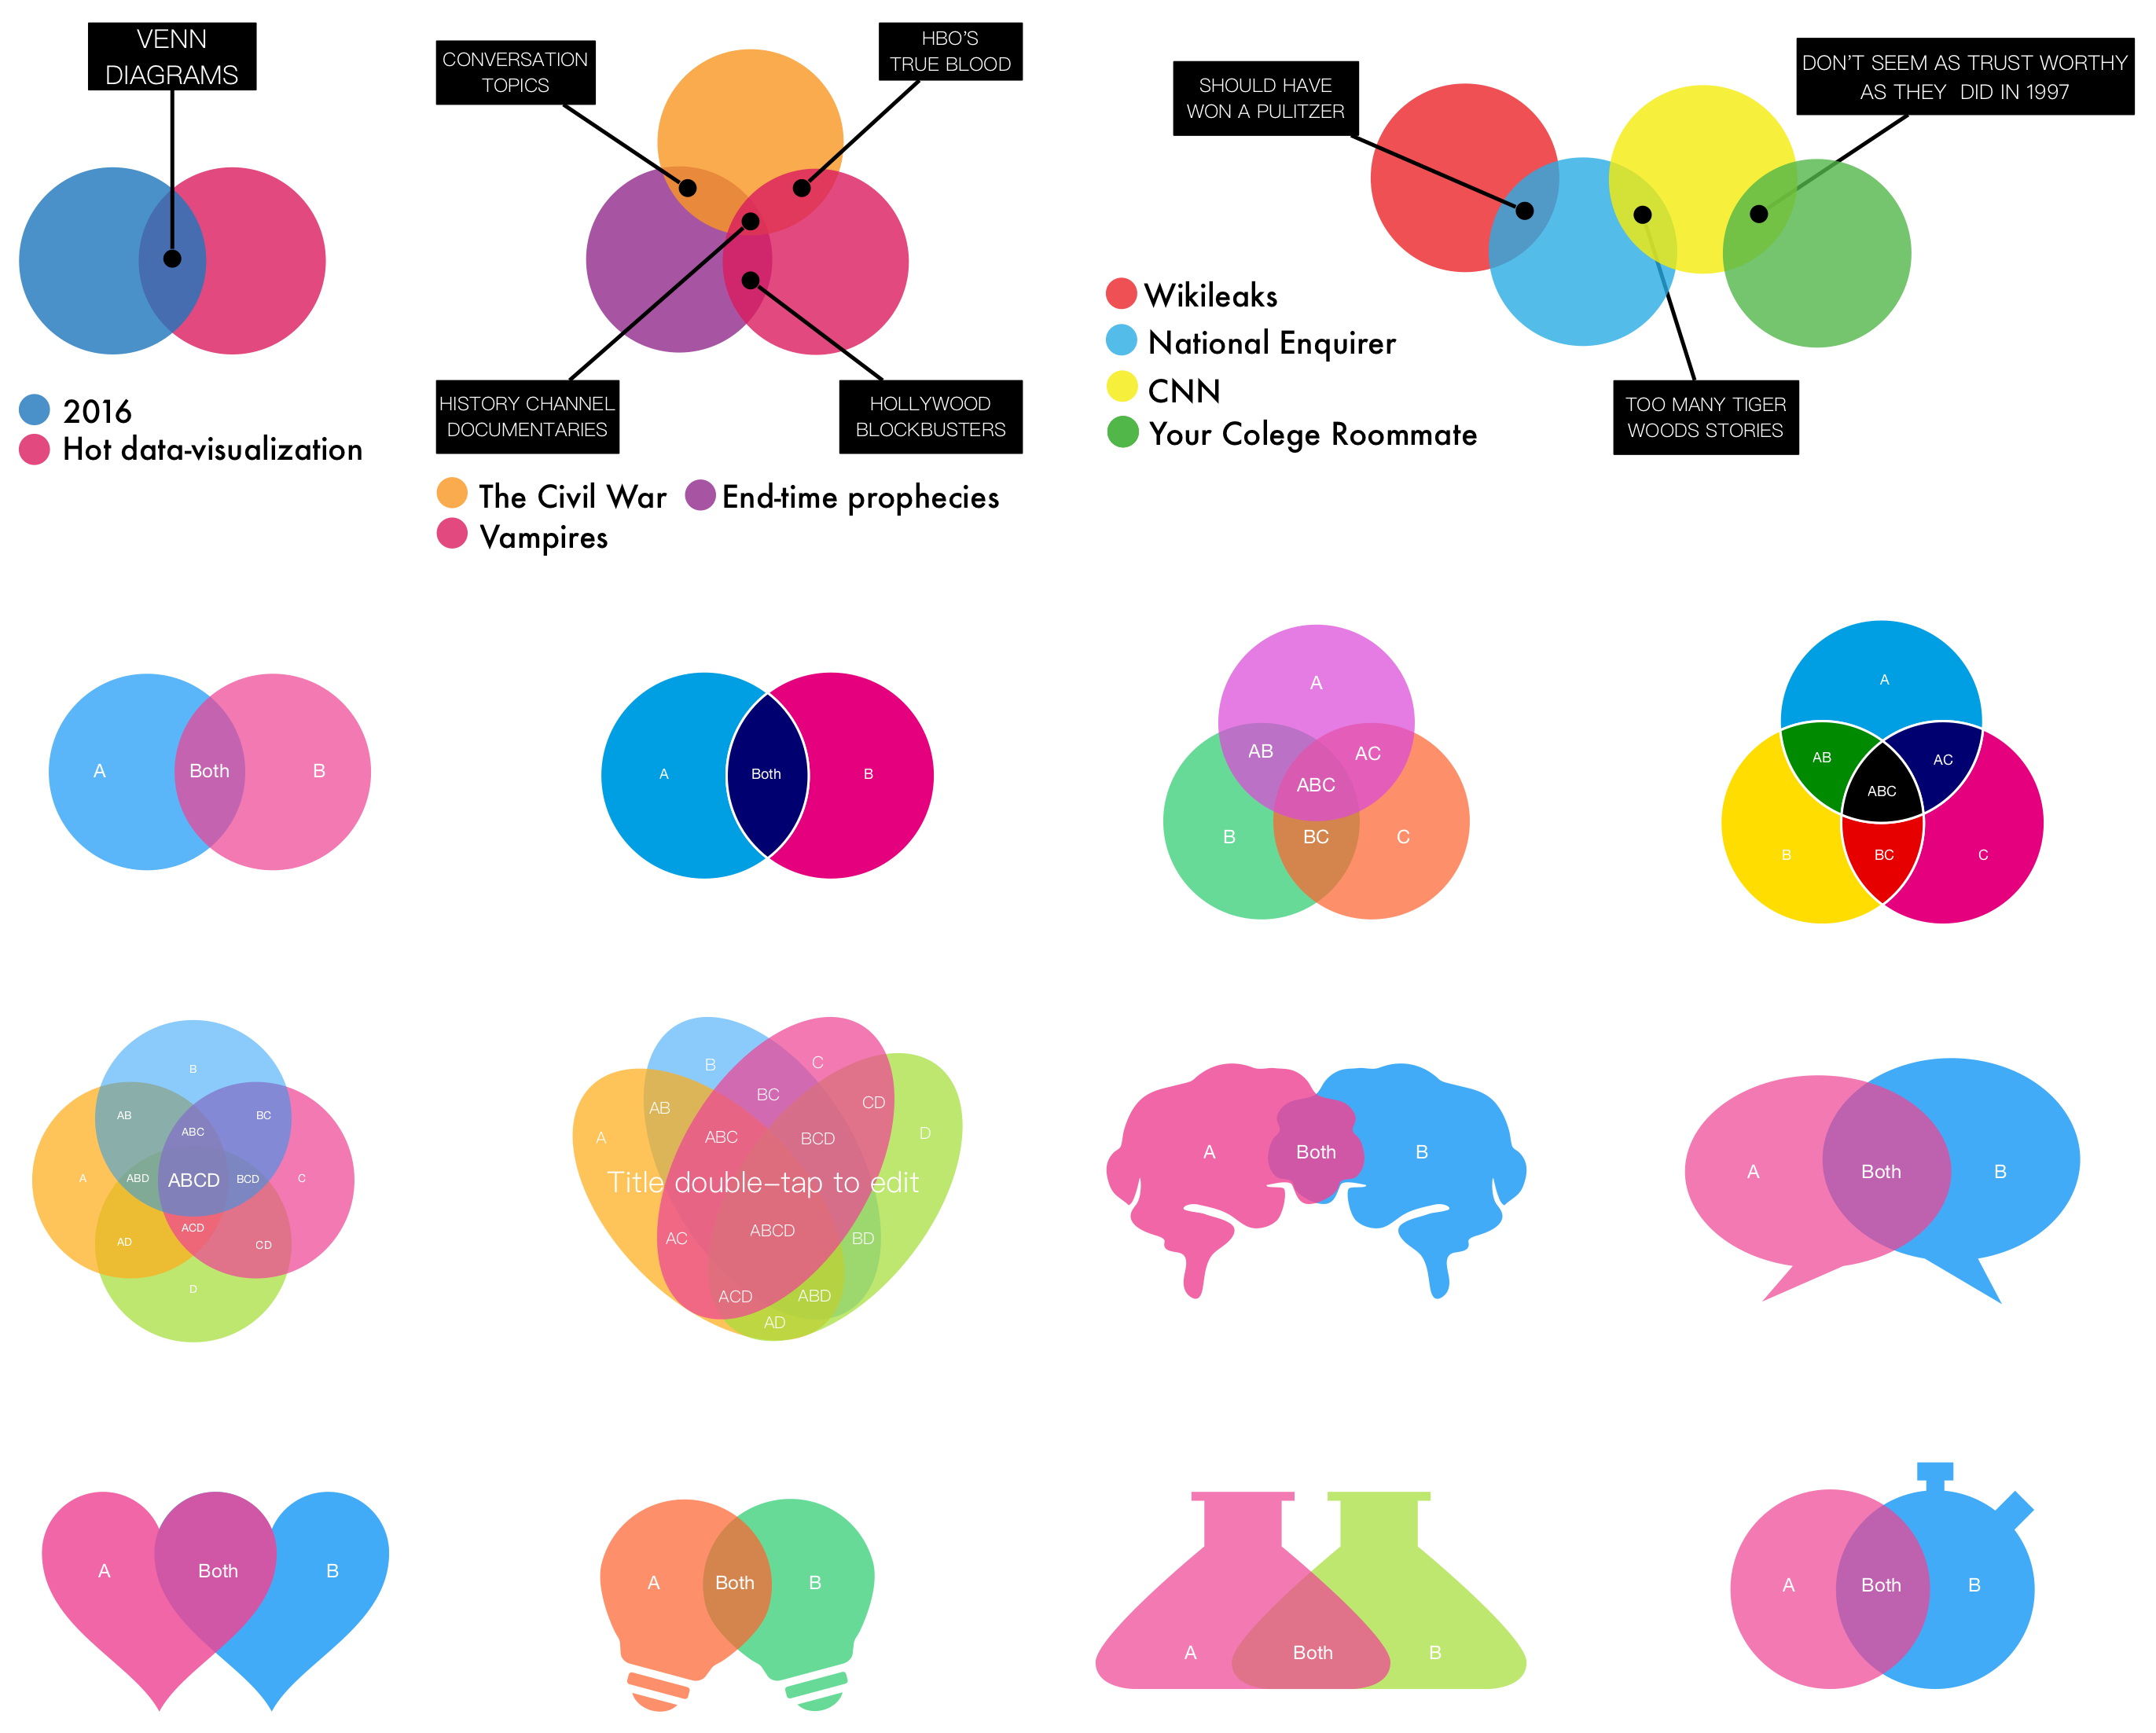
Examples on Venn Diagram
The samples you see below were created in Grafio . You can download any sample and open it in Grafio .