Total quality management (TQM) originated in the 1950s and has steadily become more popular since the early 1980s. It is a management approach to long–term success through customer satisfaction. All members of an organization participate in improving processes, products, services, and the culture in which they work.
Total quality is a description of the culture, attitude and organization of a company that strives to provide customers with products and services that satisfy their needs. The culture requires quality in all aspects of the company’s operation.
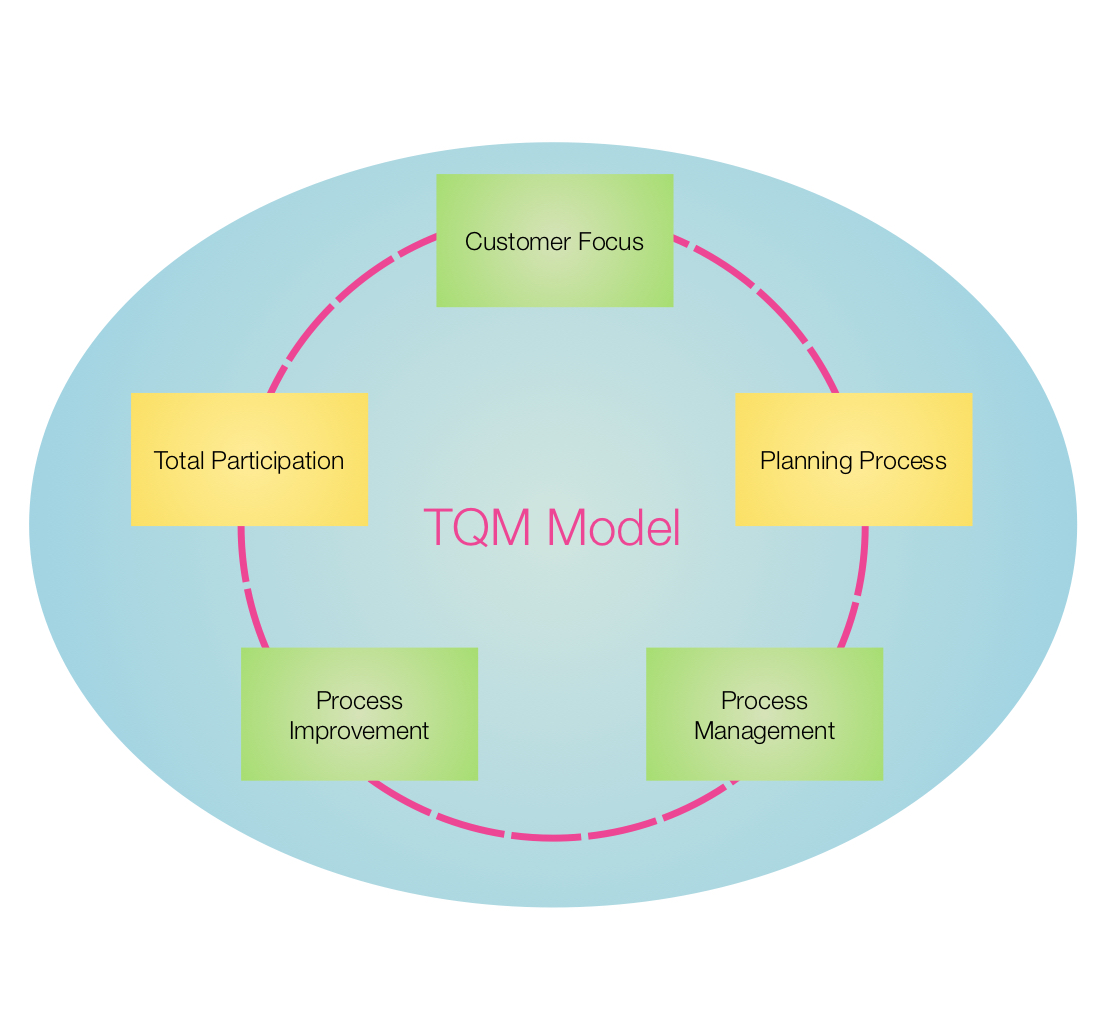
The TQM diagrams help organizations visualize business and industrial processes. TQM diagrams demonstrate the processes step-by-step in a visually, and allow comparison of the ideal and real stages of a process.
The Eight Elements of TQM
To be successful implementing TQM, an organization must concentrate on the eight key elements:
-
1.Ethics
2.Integrity
3.Trust
4.Training
5.Teamwork
6.Leadership
7.Recognition
8.Communication
Total Quality Management Benefits
- Strengthened competitive position
- Adaptability to changing or emerging market conditions
- Higher productivity
- Enhanced market image
- Elimination of defects and waste
- Reduced costs and better cost management
- Higher profitability
- Improved customer focus and satisfaction
- Increased customer loyalty and retention
- Increased job security
- Improved employee morale
- Improved and innovative processes
and many, many more…
TQM Stencils in Grafio
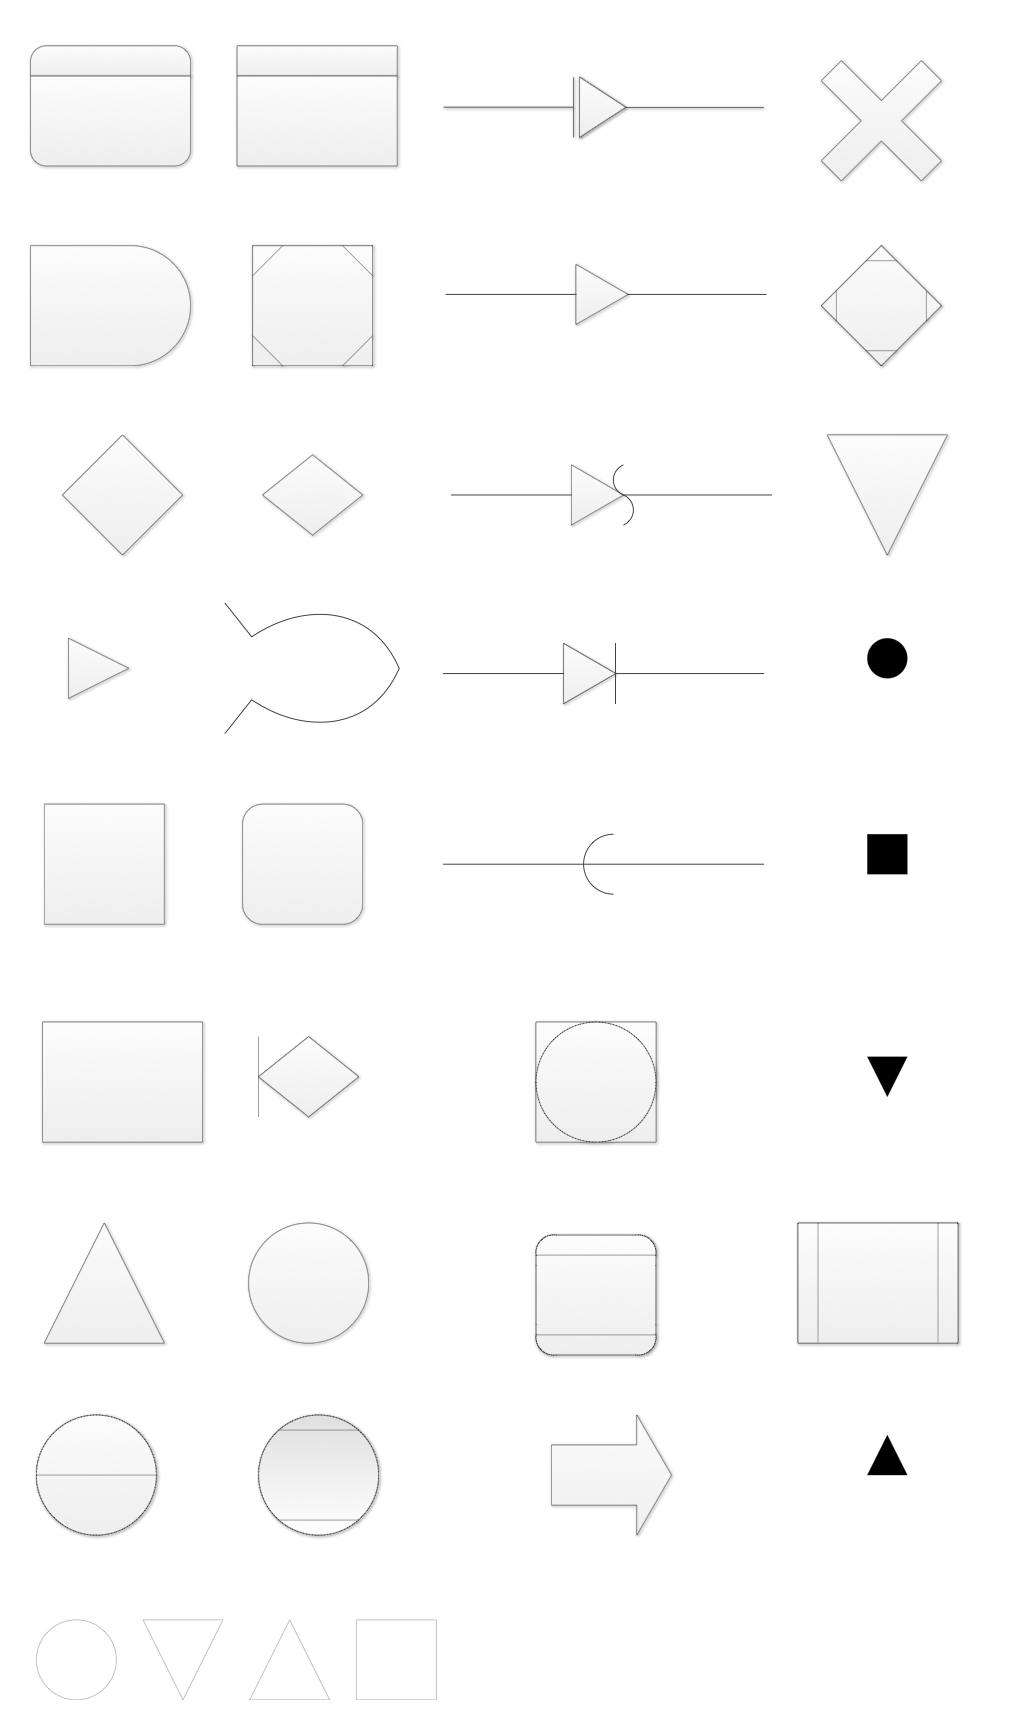
To make a good TQM diagram, it is necessary to know the meaning of the symbols that are commonly used in it. Here is a short explanation of the various TQM icons.
Storage represents the merging or storage of multiple processes or information as one.
Procedure represents predefined process, meaning that a process has occurred. This symbol is often used to define sub-processes.
Operation shows process steps which can be manual or automated.
Issue represents the action of supplying or distributing an item for use, sale, or official purposes.
Organization function represents the principle of specialization based on function or role.
Decision is used when a decision is necessary, e.g. Yes/No or True/False.
Inspection shows an Inspection point in the process flow.
Feedback arrow Whenever used, make sure feedback loop is closed.
Database represents data storage.
Connector shows a jump in the process flow from one process to another.
Flow Charts and BPMN Diagrams are also used as TQM Tools.
![]() 35 objects
35 objects
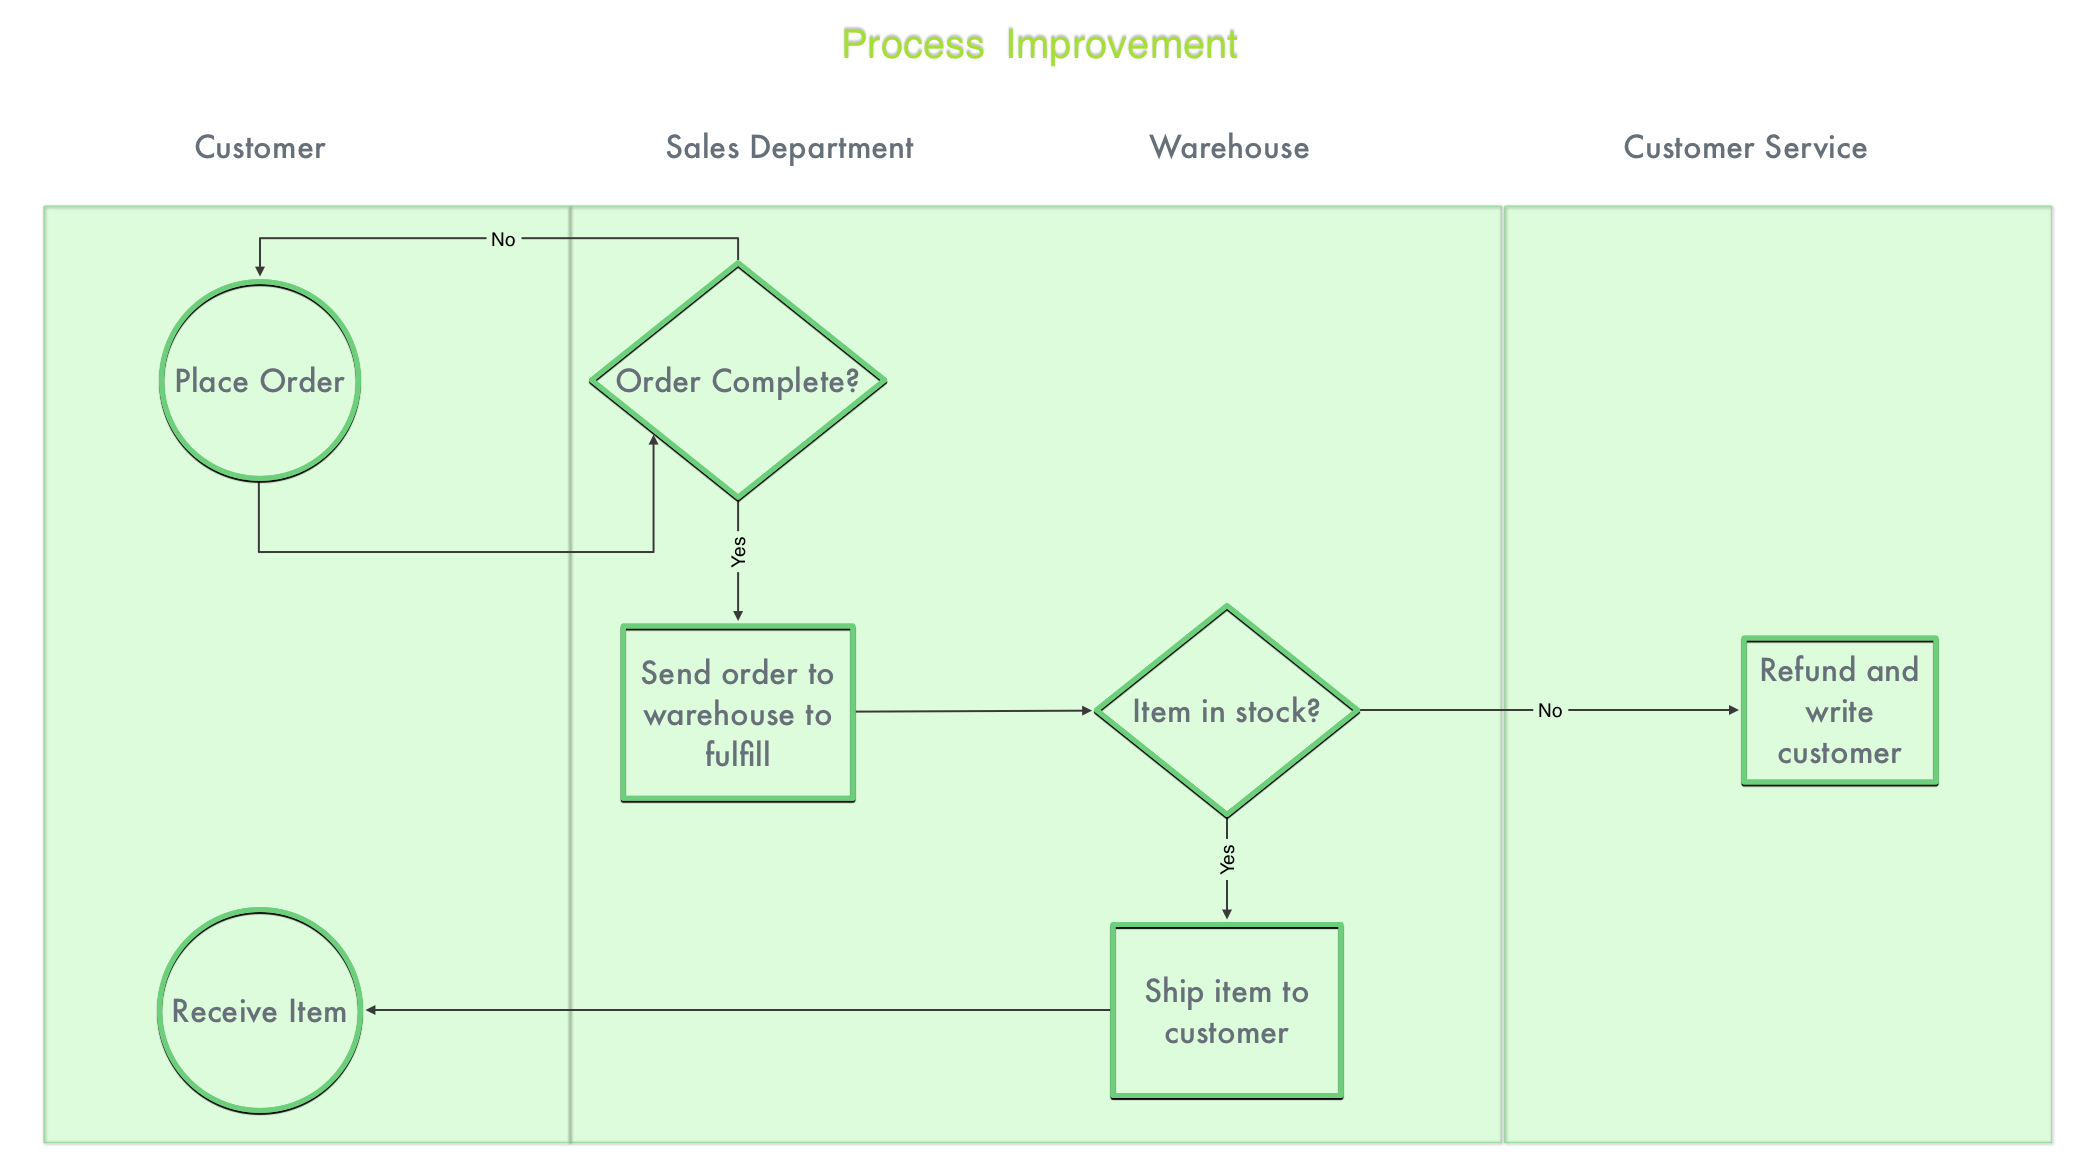
Examples on TQM Diagram
The samples you see below were created in Grafio using the TQM stencils. You can download any sample and open it in Grafio.